INTRODUCTION

This resource is a compiled set of links to user interfaces of all the tools needed to complete the forest change area estimation for Nepal. Documentation on how to use each tool is also included. Potential user-input parameter and input file adjusts, which may be needed as Nepal’s FREL is updated or new data becomes available, are noted in the documentation. These steps must be done in sequence, although the mapping methods can be completed in any order or concurrently. Results will include various forest change maps, unbiased area estimates, and uncertainty estimates.

Google Earth Engine (GEE) Workshop Repository


Click the link of the Google Earth Engine (GEE) repository below to get access to the graphic user interface (GUI)
The repository will be added to the "Reader" section under the "Script" tab. You can drag the folders into a repository of your own, where you have write access, if you want to be able to edit and save the files.

Forest Change MappingForest Change Mapping

These forest change mapping algorithms use remote sensing imagery, training data points, land cover maps, and analysis of time series data to try and map areas of forest loss, degradation, and/or regrowth. Each of these options is useful for detecting changes in a slightly different manner. However, all maps are susceptible to bias, which is why the area of map classes from the resulting maps should not be directly used for activity data reporting. These maps will be used for sample design, making sure areas that likely experienced a forest change are well sampled in the unbiased area estimation.

CCDC-SMA

mapping year of first forest disturbance
Mapping year of first forest disturbance

Continuous Change Detection and Classification - Spectral Mixture Analysis (CCDC-SMA) monitors abrupt and gradual forest degradation. It uses fractions of spectral endmembers and Normalized Degradation Fraction Index (NDFI) in the harmonic models to predict future observations. If the predictions of the fractions of endmembers and NDFI significantly deviate from several consecutive observations, the CCDC-SMA model will trigger a break and a new model will start. Please see details in Chen et al. (2021) and Forest Degradation Georgia.

mapping year of first forest disturbance
Mapping change strata

Procedure Document

Tools (in CCDCSMA App folder of the GEE repository):

  • 1_CCDC_SMA_UI_C2
  • 2_ViewExportDegDefMapp
  • 3_LTMakeLossGainPostprocessed
  • 4_AssembleMap

CODED

Continuous Degradation Detection (CODED) algorithm detects forest canopy disturbances and classifies them as degradation or deforestation based on land cover. CODED uses linear spectral unmixing to generate subpixel fractions of spectral endmembers, which are used to calculate a time series of the Normalized Degradation Fraction Index (NDFI). The calculated level of NDFI is compared with the expected range of NDFI, accounting for seasonal variation. CODED’s general workflow is to: (1) create NDFI time series graphs, (2) flag forest disturbances based on NDFI change scores, (3) classify the land cover type before and after a disturbance, and (4) reclassify the disturbances as deforestation, degradation, stable forest, or stable non-forest. See Bullock et al. (2020) and CODED Read the Docs for further algorithm details.

Training data points used for running CODED in Nepal

Procedure Document

Resources

LANDTRENDR

The LandTrendr algorithms use simple statistical techniques to simplify a time-series of spectral values into a sequence of connected straight-line segments that capture the overall shape of that pixel’s trajectory while omitting year-to-year noise. The resultant segments can then be examined to select periods where the trajectory displays behaviors of interest such as disturbance or growth. Algorithm details are available in the LT-GEE Manual (https://emapr.github.io/LT-GEE/) and in Kennedy et al. (2010).

RGB change imagery generated in LandTrendr tool

Procedure Document

Tools (in LandTrendr App folder of the GEE repository):

  • 1_UI-ImageScreener (optional)
  • 2_LT-Data-Visualization-NepalTool

MTDD

Collection of training data

Multi-variate Time-series Disturbance Detection (MTDD) classifies initially forested areas into stable forest, degraded, and deforested by training a random forest classifier with 66 metrics. These metrics are derived from six annual time-series (i.e., NDVI, two SWIR spectral regions, two NDWI indices, and SAVI) which are used to calculate eleven descriptive statistics (i.e., minimum, maximum, range, mean, standard deviation, coefficient of variation, kurtosis, skewness, slope, maximum 5-year slope, and most recent value). Overall MTDD’s process includes five main steps: (1) making annual time series, (2) calculating 11 descriptive statistics for the time series, (3) generating training/validation points, (4) training a random forest classifier, and (5) validating the classification.

Mapping forest change strata

Procedure Document

Tools (in MTDD App folder of GEE repository):

  • 1MTDD_app_trainingpoints
  • 2MTDD_app_changemap

Map Visualization and ComparisonMap Visualization and Comparison

Each of the four change mapping methods excels in its own way and will underestimates or overestimate changes differently. Each map should be visually assessed and have any parameters adjusted as needed.

Use the tools in this step to gather imagery examples for reporting and better understand the results from each map.

Visualization tool
Visualization tool

Tools:

You can compare all the maps you made visually using:

  • 1_VisualizationApp_Nepal (in Visualization App folder of GEE repository)

Map Visualization and ComparisonSample Design

A sample based approach will be used to complete area estimation. This approach is preferred over pixel-counting methods because all maps have errors. Using pixel-counting methods will produce biased estimates of area, and one cannot know whether these are overestimates or underestimates for each strata. Sample based approaches create unbiased estimates of area and the error associated with your map. The agreement map will be used to help select a random subset of the points that are representative of the landscape. The goal is to ensure that no strata is undersampled.

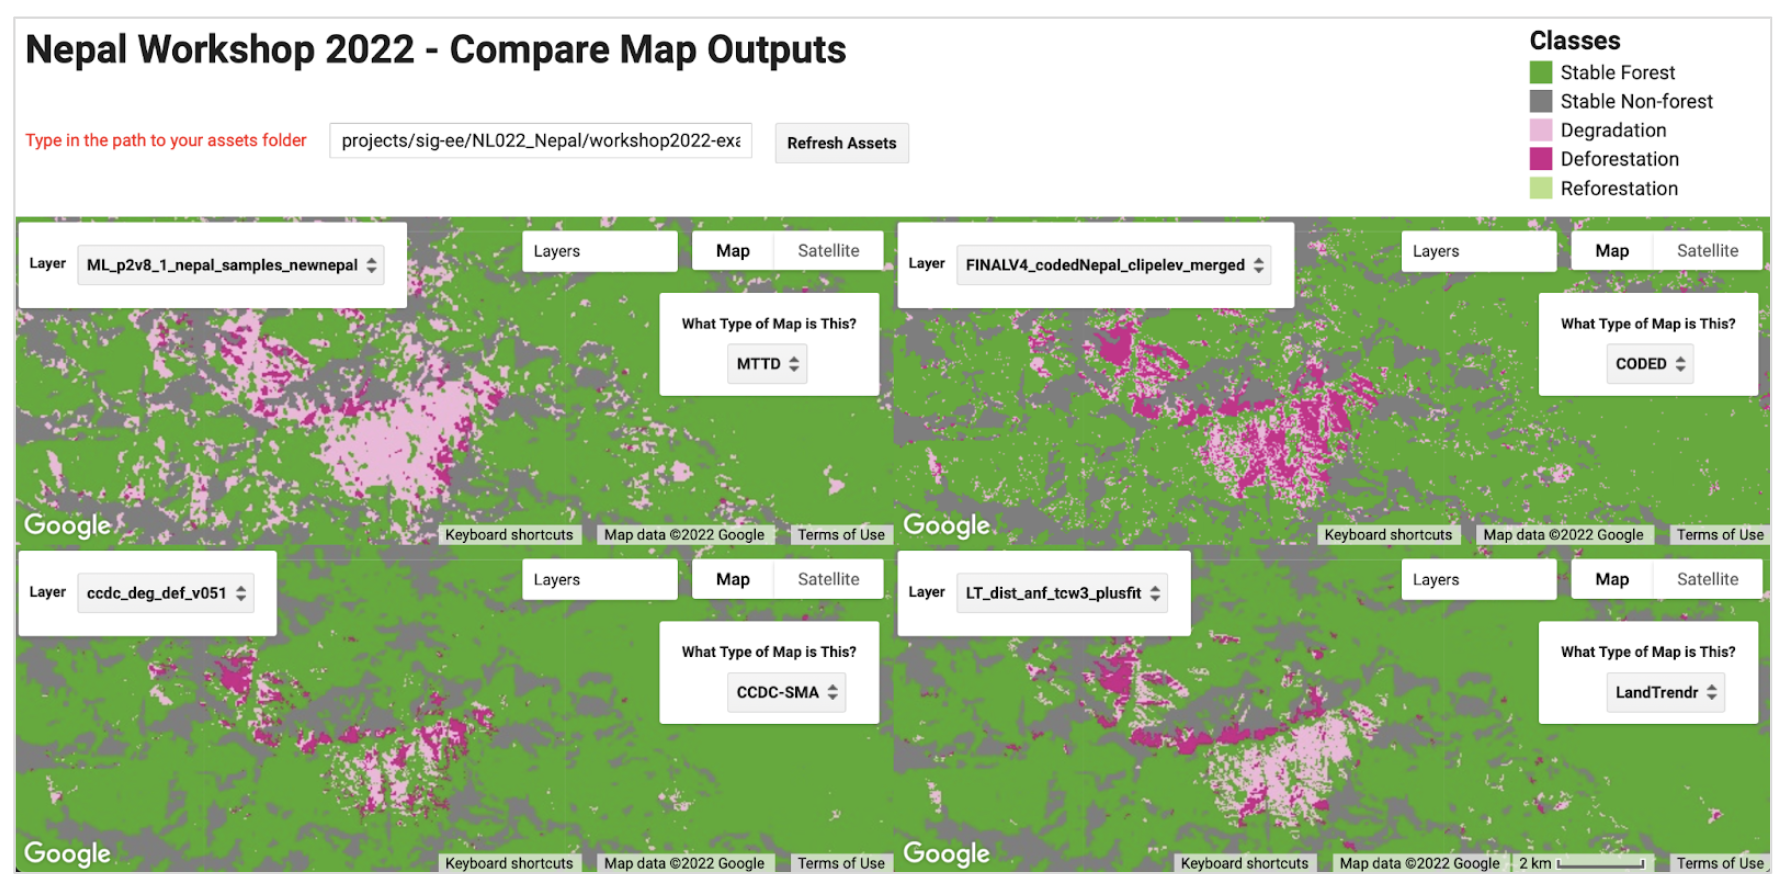
To ensure that the degradation and deforestation areas were very well sampled for the unbiased area estimation, an agreement map generated from the final results of all four methods will be used for sample design. The final results from this step will be a pixel-count of the agreement strata and the agreement map, which will be used in the next stage. The resulting strata of this tool will be anywhere 1-4 algorithms agreed there was a certain kind of change event or stable forest/nonforest, anywhere the different algorithms labeled different types of change events, anywhere all 4 algorithms labeled nonforest, and anywhere all 4 algorithms labeled forest. Counting the pixels per strata will be Page 1 of the tool.

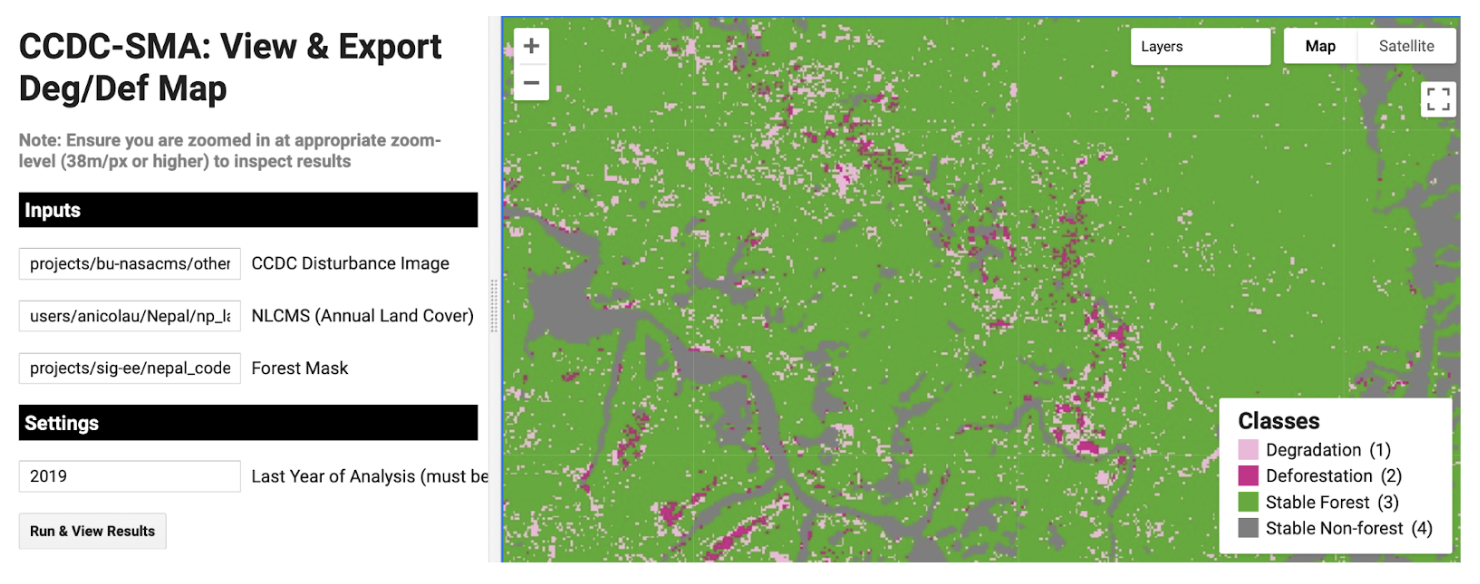
Final strata values for the agreement map and their human-readable labels are… 1:LOSS, 2:DEG, 3:GAIN, 4:ComboChange, 5:Nonforest, 6:Forest

The number of points randomly selected will depend on the relative area available in each strata, the human resources available to do interpretations, and a target standard error. The linked spreadsheet contains equations needed to calculate the ideal sample size in order to hopefully achieve the target standard error. This analysis should be completed between Page 1 and Page 2 of the 1_MakeAgreementMap_Nepal tool. The total number of points could be decreased if it is deemed too large a sample to be collected with existing resources, or increased if more points are needed after QA/QC.

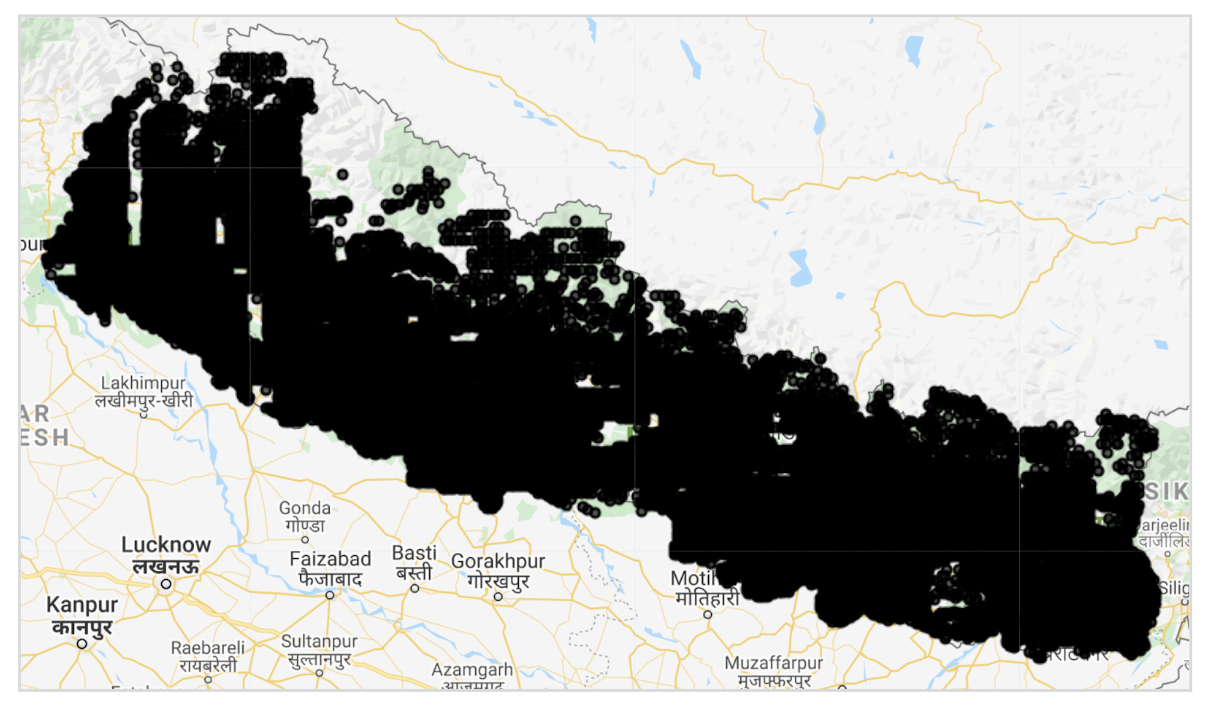
Once you calculate the total number of samples you must distribute them across the strata. If with a proportional distribution of the points to each strata, one or more of the strata is allocated too few samples, you should require a minimum sample size for these strata, and then proportionally distribute the remaining points to the larger strata. These numbers generated in the spreadsheet can then be input used to complete Page 2 of the 1_MakeAgreementMap_Nepal tool and export a random set of sample points.

Procedure Document

Tools:

Map Visualization and ComparisonReference data collection (completed in CEO)

This portion of the workshop will explain:

  1. Creating an interpretation key

  2. Generating a CEO project from a template

  3. Performing QA/QC with reference data collection

Map Visualization and ComparisonArea and Uncertainty Estimation

You cannot simply count pixels in a map to report on areas of change because all maps have errors. Errors are often systematic, which results in biased estimates of changes. Anytime you can say ‘the map represents this thing well, but this other thing not so well’, that is a systematic error that will result in over or underestimating areas. A sample based approach to estimate area using a map is one way to correct bias inherent in maps and also quantify uncertainty. Additionally, when you have a stratification map with strata that does not directly correspond to the classes for which you are estimating area, further care must be taken to make sure the results consider area proportions within the design.

You must first generate a confusion matrix comparing the sample point labels from the map strata (your algorithm agreement map) to those labels provided by the reference data (interpreter collected data from CEO).Then you can calculate the unbiased area estimates and uncertainties using a spreadsheet following the equations and best practice procedures from Olofsson et al. (2014  & 2020).

Monte CarloMonte Carlo

This workshop will be an introduction to Monte Carlo. We will work through the materials provided by QUERCA (Quantifying Uncertainty Estimates and Risk for Carbon Accounting). An introductory video has been provided by Andy Gillespie.

For further information:

FCPF Monte Carlo guidance is available at the FCPF template and guidance page: https://www.forestcarbonpartnership.org/requirements-and-templates.

Link for the QUERCA home page:
Forest Ecosystem Science Laboratory.

Link:


Technical support and procedure development provided by:

Nepal Government
Government of Nepal
Spatial Informatics Group (SIG)
SilvaCarbon
SilvaCarbon
SIG-NAL
SIG-NAL